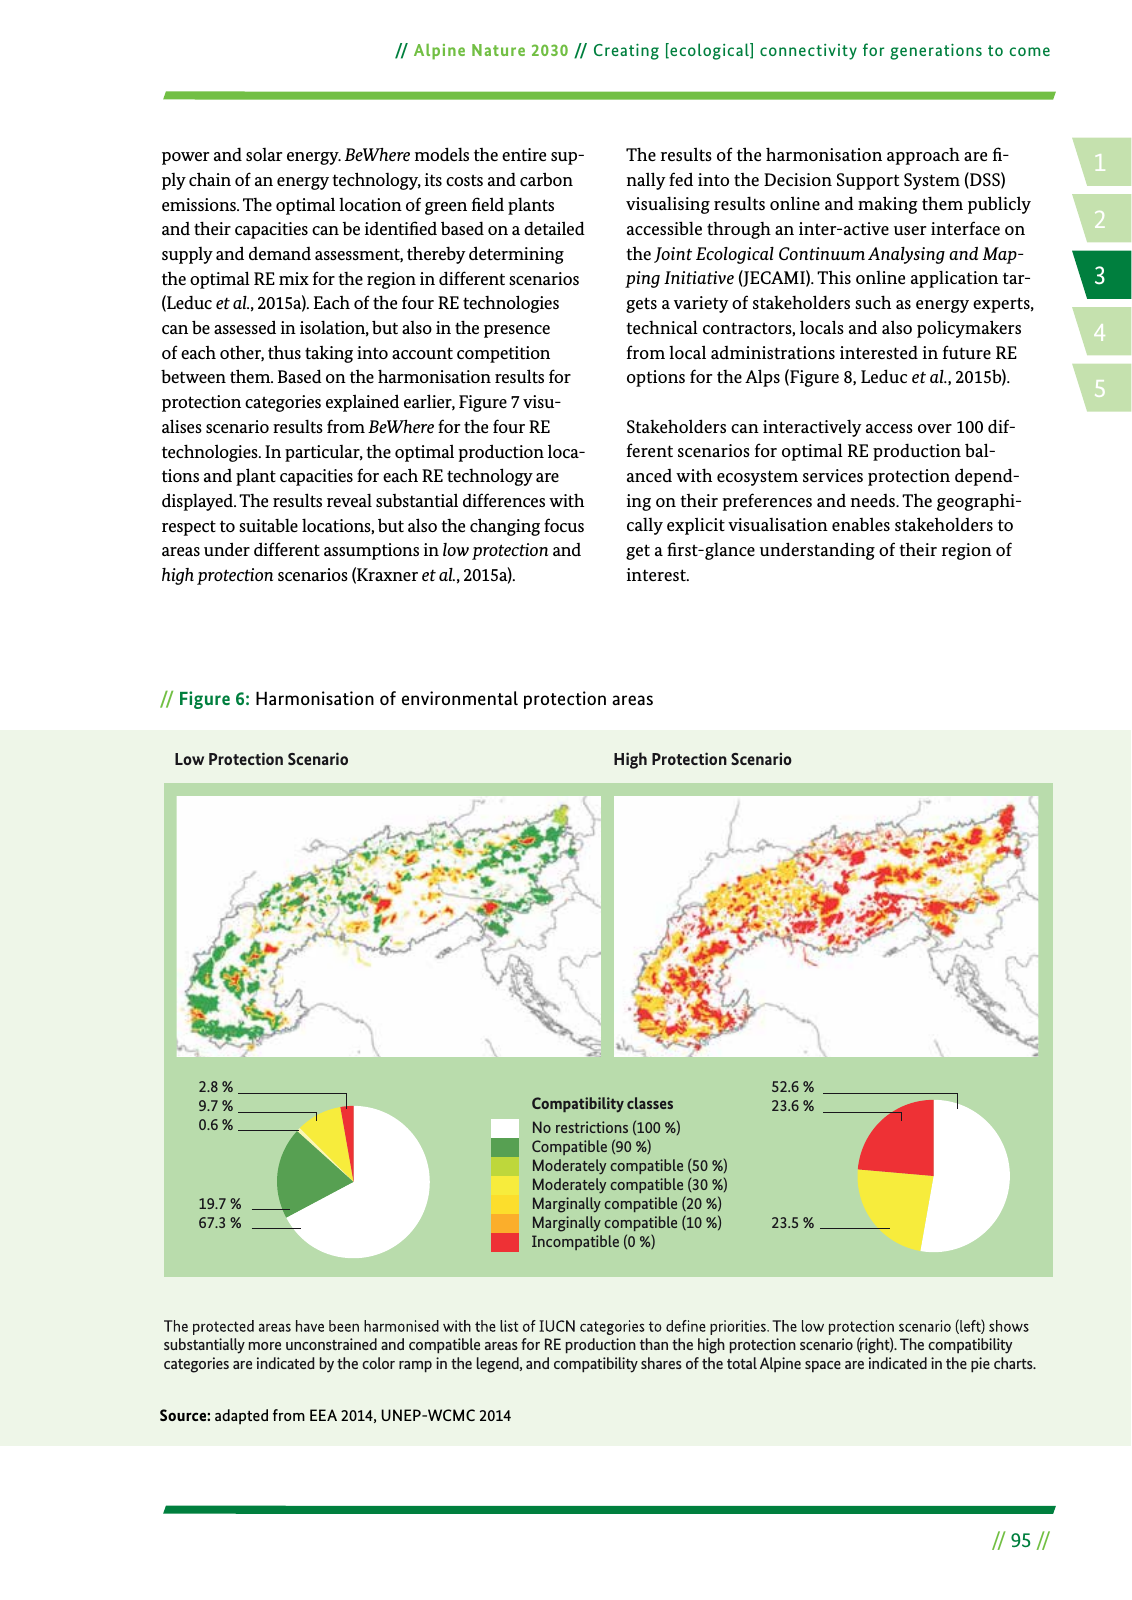
14 2 5 3 Alpine Nature 2030 Creating ecological connectivity for generations to come 95 power and solar energy BeWhere models the entire sup ply chain of an energy technology its costs and carbon emissions The optimal location of green eld plants and their capacities can be identi ed based on a detailed supply and demand assessment thereby determining the optimal RE mix for the region in different scenarios Leduc et al 2015a Each of the four RE technologies can be assessed in isolation but also in the presence of each other thus taking into account competition between them Based on the harmonisation results for protection categories explained earlier Figure 7 visu alises scenario results from BeWhere for the four RE technologies In particular the optimal production loca tions and plant capacities for each RE technology are displayed The results reveal substantial differences with respect to suitable locations but also the changing focus areas under different assumptions in low protection and high protection scenarios Kraxner et al 2015a The results of the harmonisation approach are nally fed into the Decision Support System DSS visualising results online and making them publicly accessible through an inter active user interface on the Joint Ecological Continuum Analysing and Map ping Initiative JECAMI This online application tar gets a variety of stakeholders such as energy experts technical contractors locals and also policymakers from local administrations interested in future RE options for the Alps Figure 8 Leduc et al 2015b Stakeholders can interactively access over 100 dif ferent scenarios for optimal RE production bal anced with ecosystem services protection depend ing on their preferences and needs The geographi cally explicit visualisation enables stakeholders to get a rst glance understanding of their region of interest Figure 6 Harmonisation of environmental protection areas Source adapted from EEA 2014 UNEP WCMC 2014 substantially more unconstrained and compatible areas for RE production than the high protection scenario right The compatibility categories are indicated by the color ramp in the legend and compatibility shares of the total Alpine space are indicated in the pie charts Low Protection Scenario High Protection Scenario 0 6 23 5 19 7 67 3 2 8 52 6 9 7 23 6 Compatibility classes No restrictions 100 Compatible 90 Moderately compatible 50 Moderately compatible 30 Marginally compatible 20 Marginally compatible 10 Incompatible 0
Hinweis: Dies ist eine maschinenlesbare No-Flash Ansicht.
Klicken Sie hier um zur Online-Version zu gelangen.
Klicken Sie hier um zur Online-Version zu gelangen.