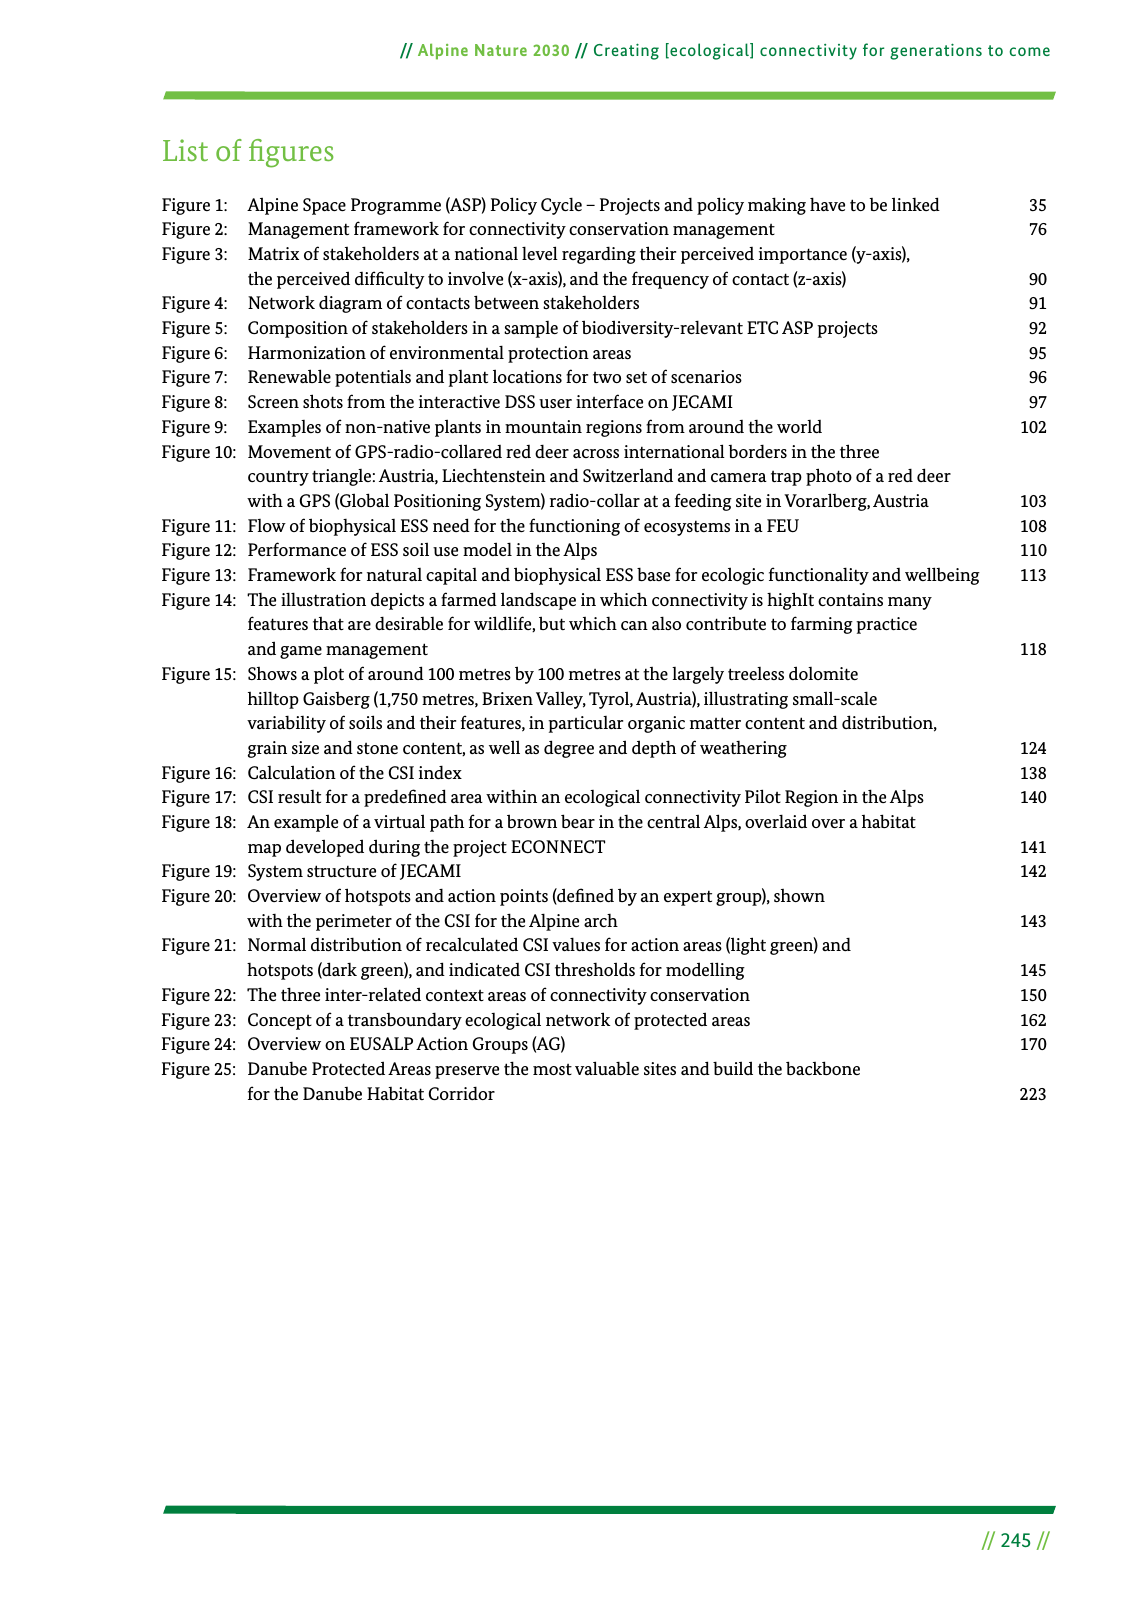
245 Alpine Nature 2030 Creating ecological connectivity for generations to come Figure 1 Alpine Space Programme ASP Policy Cycle Projects and policy making have to be linked 35 Figure 2 Management framework for connectivity conservation management 76 Figure 3 Matrix of stakeholders at a national level regarding their perceived importance y axis the perceived dif culty to involve x axis and the frequency of contact z axis 90 Figure 4 Network diagram of contacts between stakeholders 91 Figure 5 Composition of stakeholders in a sample of biodiversity relevant ETC ASP projects 92 Figure 6 Harmonization of environmental protection areas 95 Figure 7 Renewable potentials and plant locations for two set of scenarios 96 Figure 8 Screen shots from the interactive DSS user interface on JECAMI 97 Figure 9 Examples of non native plants in mountain regions from around the world 102 Figure 10 Movement of GPS radio collared red deer across international borders in the three country triangle Austria Liechtenstein and Switzerland and camera trap photo of a red deer with a GPS Global Positioning System radio collar at a feeding site in Vorarlberg Austria 103 Figure 11 Flow of biophysical ESS need for the functioning of ecosystems in a FEU 108 Figure 12 Performance of ESS soil use model in the Alps 110 Figure 13 Framework for natural capital and biophysical ESS base for ecologic functionality and wellbeing 113 Figure 14 The illustration depicts a farmed landscape in which connectivity is highIt contains many features that are desirable for wildlife but which can also contribute to farming practice and game management 118 Figure 15 Shows a plot of around 100 metres by 100 metres at the largely treeless dolomite hilltop Gaisberg 1 750 metres Brixen Valley Tyrol Austria illustrating small scale variability of soils and their features in particular organic matter content and distribution grain size and stone content as well as degree and depth of weathering 124 Figure 16 Calculation of the CSI index 138 Figure 17 CSI result for a prede ned area within an ecological connectivity Pilot Region in the Alps 140 Figure 18 An example of a virtual path for a brown bear in the central Alps overlaid over a habitat map developed during the project ECONNECT 141 Figure 19 System structure of JECAMI 142 Figure 20 Overview of hotspots and action points de ned by an expert group shown with the perimeter of the CSI for the Alpine arch 143 Figure 21 Normal distribution of recalculated CSI values for action areas light green and hotspots dark green and indicated CSI thresholds for modelling 145 Figure 22 The three inter related context areas of connectivity conservation 150 Figure 23 Concept of a transboundary ecological network of protected areas 162 Figure 24 Overview on EUSALP Action Groups AG 170 Figure 25 Danube Protected Areas preserve the most valuable sites and build the backbone for the Danube Habitat Corridor 223 List of gures

Hinweis: Dies ist eine maschinenlesbare No-Flash Ansicht.
Klicken Sie hier um zur Online-Version zu gelangen.
Klicken Sie hier um zur Online-Version zu gelangen.