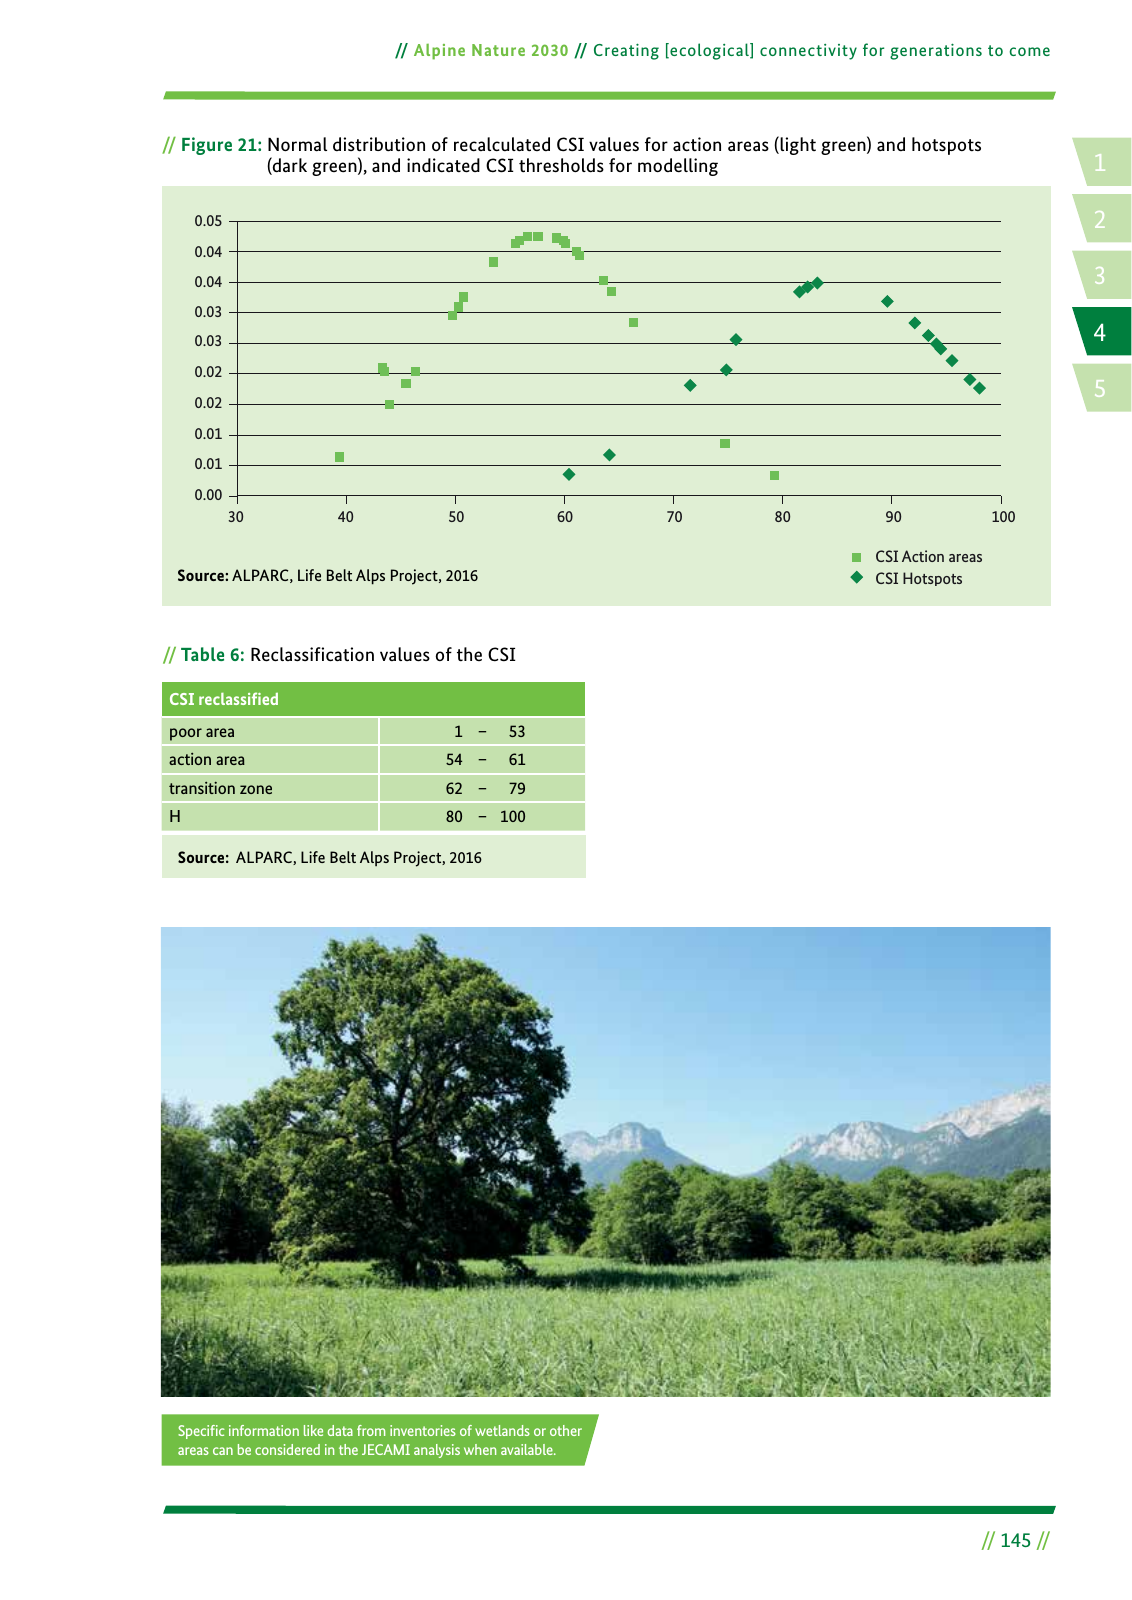
14 2 5 3 Alpine Nature 2030 Creating ecological connectivity for generations to come 145 Source ALPARC Life Belt Alps Project 2016 Speci c information like data from inventories of wetlands or other areas can be considered in the JECAMI analysis when available CSI reclassiªed poor area 1 53 action area 54 61 transition zone 62 79 H 80 100 Figure 21 Normal distribution of recalculated CSI values for action areas light green and hotspots dark green and indicated CSI thresholds for modelling Source ALPARC Life Belt Alps Project 2016 Table 6 Reclassification values of the CSI 0 05 0 04 0 04 0 03 0 02 0 02 0 01 0 01 0 00 30 40 50 60 70 80 90 100 0 03 CSI Hotspots CSI Action areas
Hinweis: Dies ist eine maschinenlesbare No-Flash Ansicht.
Klicken Sie hier um zur Online-Version zu gelangen.
Klicken Sie hier um zur Online-Version zu gelangen.