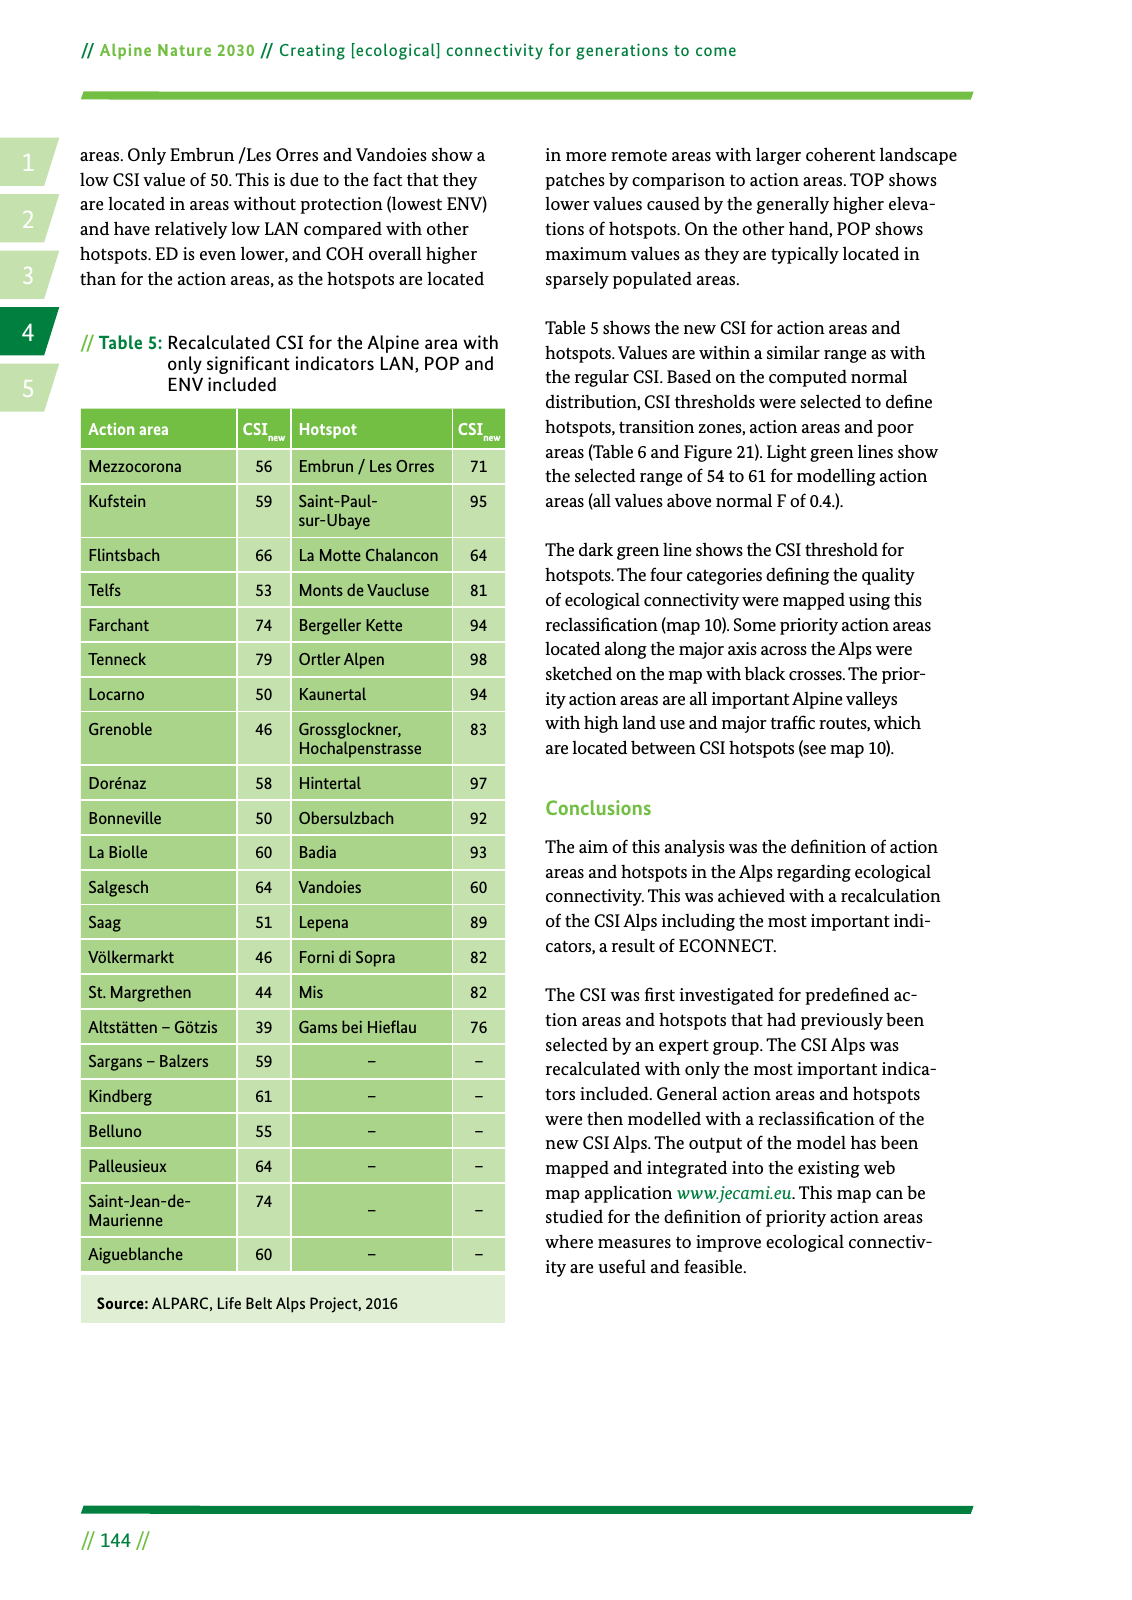
14 2 5 3 Alpine Nature 2030 Creating ecological connectivity for generations to come 144 The dark green line shows the CSI threshold for hotspots The four categories de ning the quality of ecological connectivity were mapped using this reclassi cation map 10 Some priority action areas located along the major axis across the Alps were sketched on the map with black crosses The prior ity action areas are all important Alpine valleys with high land use and major traf c routes which are located between CSI hotspots see map 10 Conclusions The aim of this analysis was the de nition of action areas and hotspots in the Alps regarding ecological connectivity This was achieved with a recalculation of the CSI Alps including the most important indi cators a result of ECONNECT The CSI was rst investigated for prede ned ac tion areas and hotspots that had previously been selected by an expert group The CSI Alps was recalculated with only the most important indica tors included General action areas and hotspots were then modelled with a reclassi cation of the new CSI Alps The output of the model has been mapped and integrated into the existing web map application www jecami eu This map can be studied for the de nition of priority action areas where measures to improve ecological connectiv ity are useful and feasible Action area CSInew Hotspot CSInew Mezzocorona 56 Embrun Les Orres 71 Kufstein 59 Saint Paul sur Ubaye 95 Flintsbach 66 La Motte Chalancon 64 Telfs 53 Monts de Vaucluse 81 Farchant 74 Bergeller Kette 94 Tenneck 79 Ortler Alpen 98 Locarno 50 Kaunertal 94 Grenoble 46 Grossglockner Hochalpenstrasse 83 Dorénaz 58 Hintertal 97 Bonneville 50 Obersulzbach 92 La Biolle 60 Badia 93 Salgesch 64 Vandoies 60 Saag 51 Lepena 89 Völkermarkt 46 Forni di Sopra 82 St Margrethen 44 Mis 82 Altstätten Götzis 39 Gams bei Hie au 76 Sargans Balzers 59 Kindberg 61 Belluno 55 Palleusieux 64 Saint Jean de Maurienne 74 Aigueblanche 60 Table 5 Recalculated CSI for the Alpine area with only significant indicators LAN POP and ENV included Source ALPARC Life Belt Alps Project 2016 Table 5 shows the new CSI for action areas and hotspots Values are within a similar range as with the regular CSI Based on the computed normal distribution CSI thresholds were selected to de ne hotspots transition zones action areas and poor areas Table 6 and Figure 21 Light green lines show the selected range of 54 to 61 for modelling action areas all values above normal F of 0 4 areas Only Embrun Les Orres and Vandoies show a low CSI value of 50 This is due to the fact that they are located in areas without protection lowest ENV and have relatively low LAN compared with other hotspots ED is even lower and COH overall higher than for the action areas as the hotspots are located in more remote areas with larger coherent landscape patches by comparison to action areas TOP shows lower values caused by the generally higher eleva tions of hotspots On the other hand POP shows maximum values as they are typically located in sparsely populated areas
Hinweis: Dies ist eine maschinenlesbare No-Flash Ansicht.
Klicken Sie hier um zur Online-Version zu gelangen.
Klicken Sie hier um zur Online-Version zu gelangen.