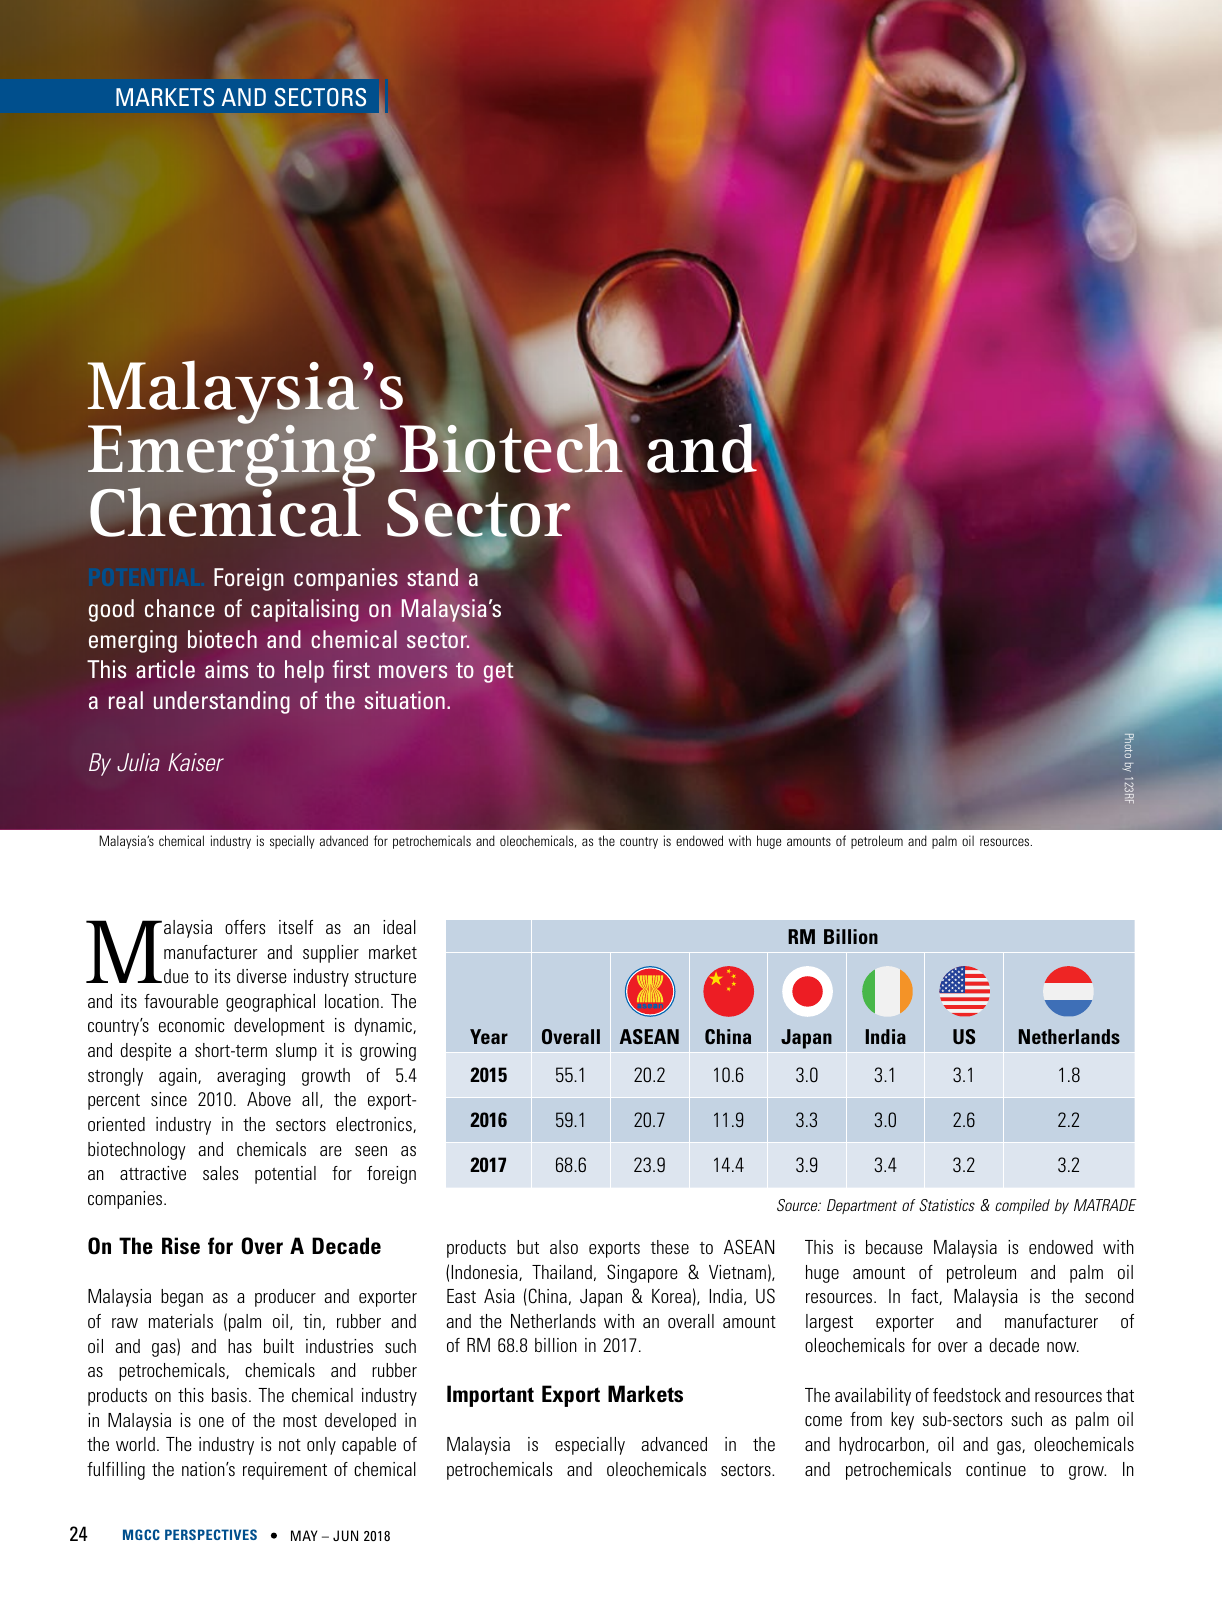
24 MGCC PERSPECTIVES MAY JUN 2018 MARKETS AND SECTORS Malaysia offers itself as an ideal manufacturer and supplier market due to its diverse industry structure and its favourable geographical location The country s economic development is dynamic and despite a short term slump it is growing strongly again averaging growth of 5 4 percent since 2010 Above all the export oriented industry in the sectors electronics biotechnology and chemicals are seen as an attractive sales potential for foreign companies On The Rise for Over A Decade Malaysia began as a producer and exporter of raw materials palm oil tin rubber and oil and gas and has built industries such as petrochemicals chemicals and rubber products on this basis The chemical industry in Malaysia is one of the most developed in the world The industry is not only capable of fulfilling the nation s requirement of chemical products but also exports these to ASEAN Indonesia Thailand Singapore Vietnam East Asia China Japan Korea India US and the Netherlands with an overall amount of RM 68 8 billion in 2017 Important Export Markets Malaysia is especially advanced in the petrochemicals and oleochemicals sectors This is because Malaysia is endowed with huge amount of petroleum and palm oil resources In fact Malaysia is the second largest exporter and manufacturer of oleochemicals for over a decade now The availability of feedstock and resources that come from key sub sectors such as palm oil and hydrocarbon oil and gas oleochemicals and petrochemicals continue to grow In Malaysia s Emerging Biotech and Chemical Sector POTENTIAL Foreign companies stand a good chance of capitalising on Malaysia s emerging biotech and chemical sector This article aims to help first movers to get a real understanding of the situation By Julia Kaiser Photo by 123RF Malaysia s chemical industry is specially advanced for petrochemicals and oleochemicals as the country is endowed with huge amounts of petroleum and palm oil resources RM Billion Year Overall ASEAN China Japan India US Netherlands 2015 55 1 20 2 10 6 3 0 3 1 3 1 1 8 2016 59 1 20 7 11 9 3 3 3 0 2 6 2 2 2017 68 6 23 9 14 4 3 9 3 4 3 2 3 2 Source Department of Statistics compiled by MATRADE
Hinweis: Dies ist eine maschinenlesbare No-Flash Ansicht.
Klicken Sie hier um zur Online-Version zu gelangen.
Klicken Sie hier um zur Online-Version zu gelangen.