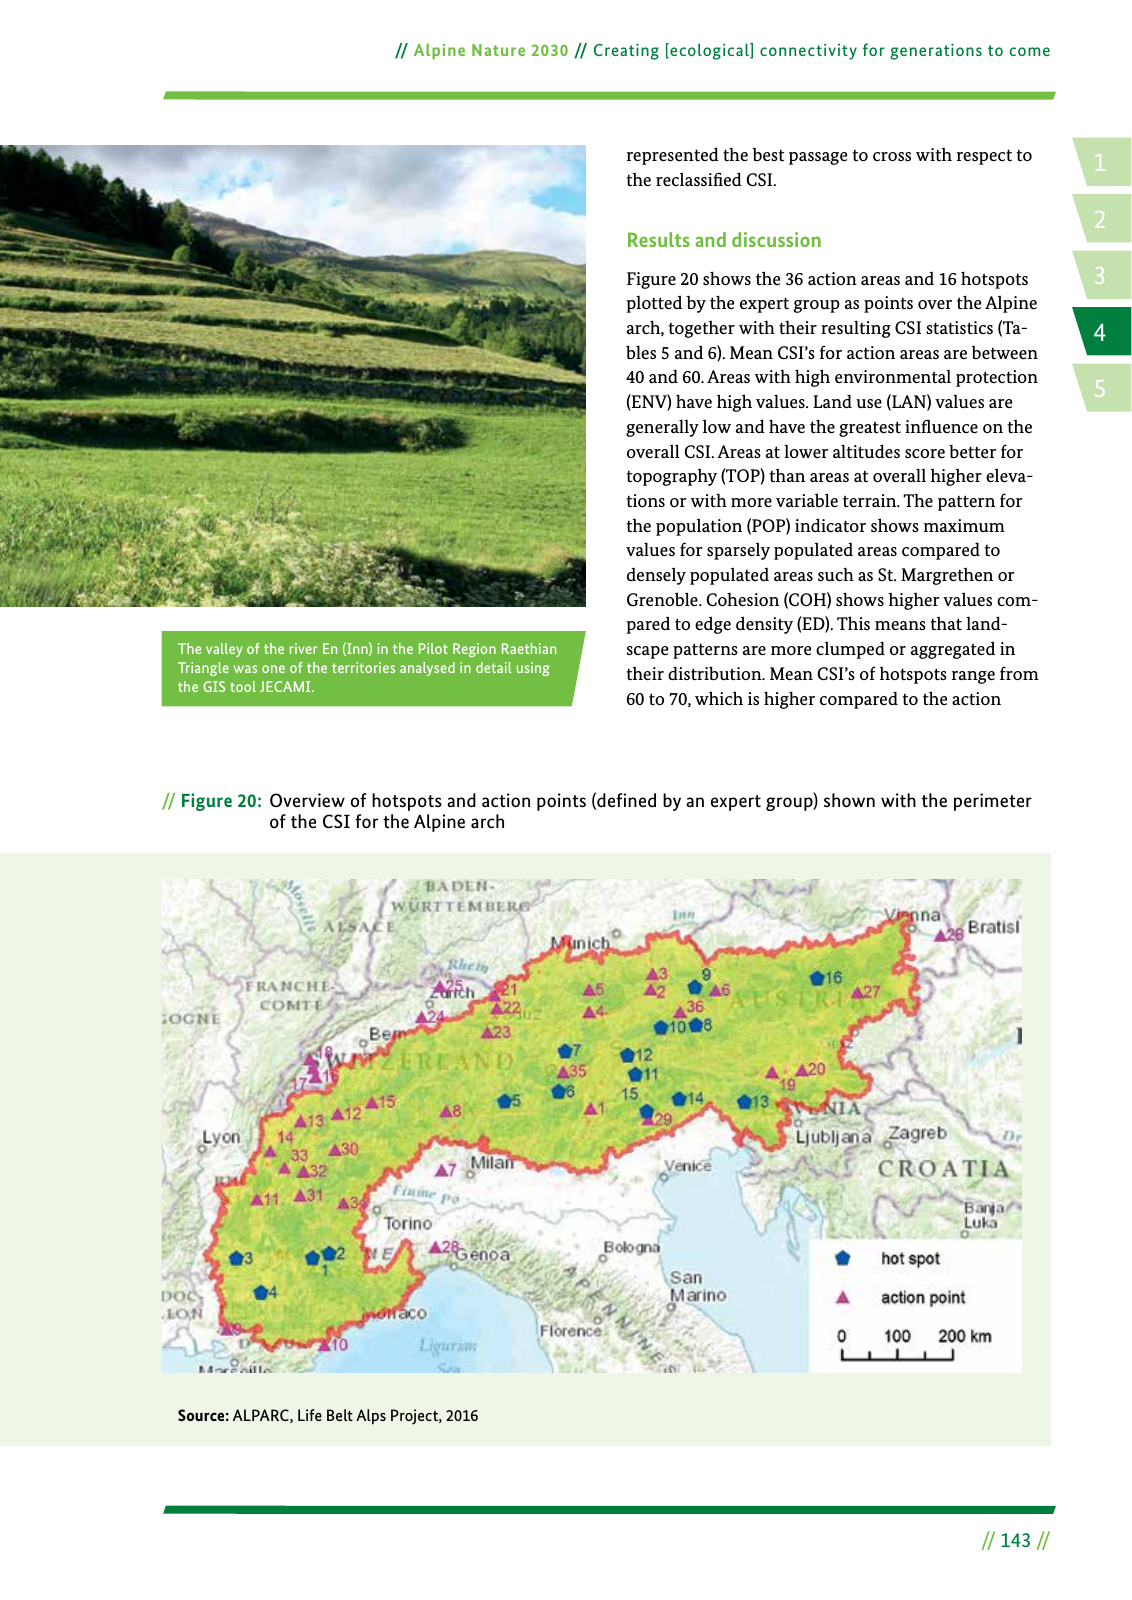
14 2 5 3 Alpine Nature 2030 Creating ecological connectivity for generations to come 143 Figure 20 Overview of hotspots and action points defined by an expert group shown with the perimeter of the CSI for the Alpine arch represented the best passage to cross with respect to the reclassi ed CSI Results and discussion Figure 20 shows the 36 action areas and 16 hotspots plotted by the expert group as points over the Alpine arch together with their resulting CSI statistics Ta bles 5 and 6 Mean CSI s for action areas are between 40 and 60 Areas with high environmental protection ENV have high values Land use LAN values are generally low and have the greatest in uence on the overall CSI Areas at lower altitudes score better for topography TOP than areas at overall higher eleva tions or with more variable terrain The pattern for the population POP indicator shows maximum values for sparsely populated areas compared to densely populated areas such as St Margrethen or Grenoble Cohesion COH shows higher values com pared to edge density ED This means that land scape patterns are more clumped or aggregated in their distribution Mean CSI s of hotspots range from 60 to 70 which is higher compared to the action Source ALPARC Life Belt Alps Project 2016 The valley of the river En Inn in the Pilot Region Raethian Triangle was one of the territories analysed in detail using the GIS tool JECAMI
Hinweis: Dies ist eine maschinenlesbare No-Flash Ansicht.
Klicken Sie hier um zur Online-Version zu gelangen.
Klicken Sie hier um zur Online-Version zu gelangen.