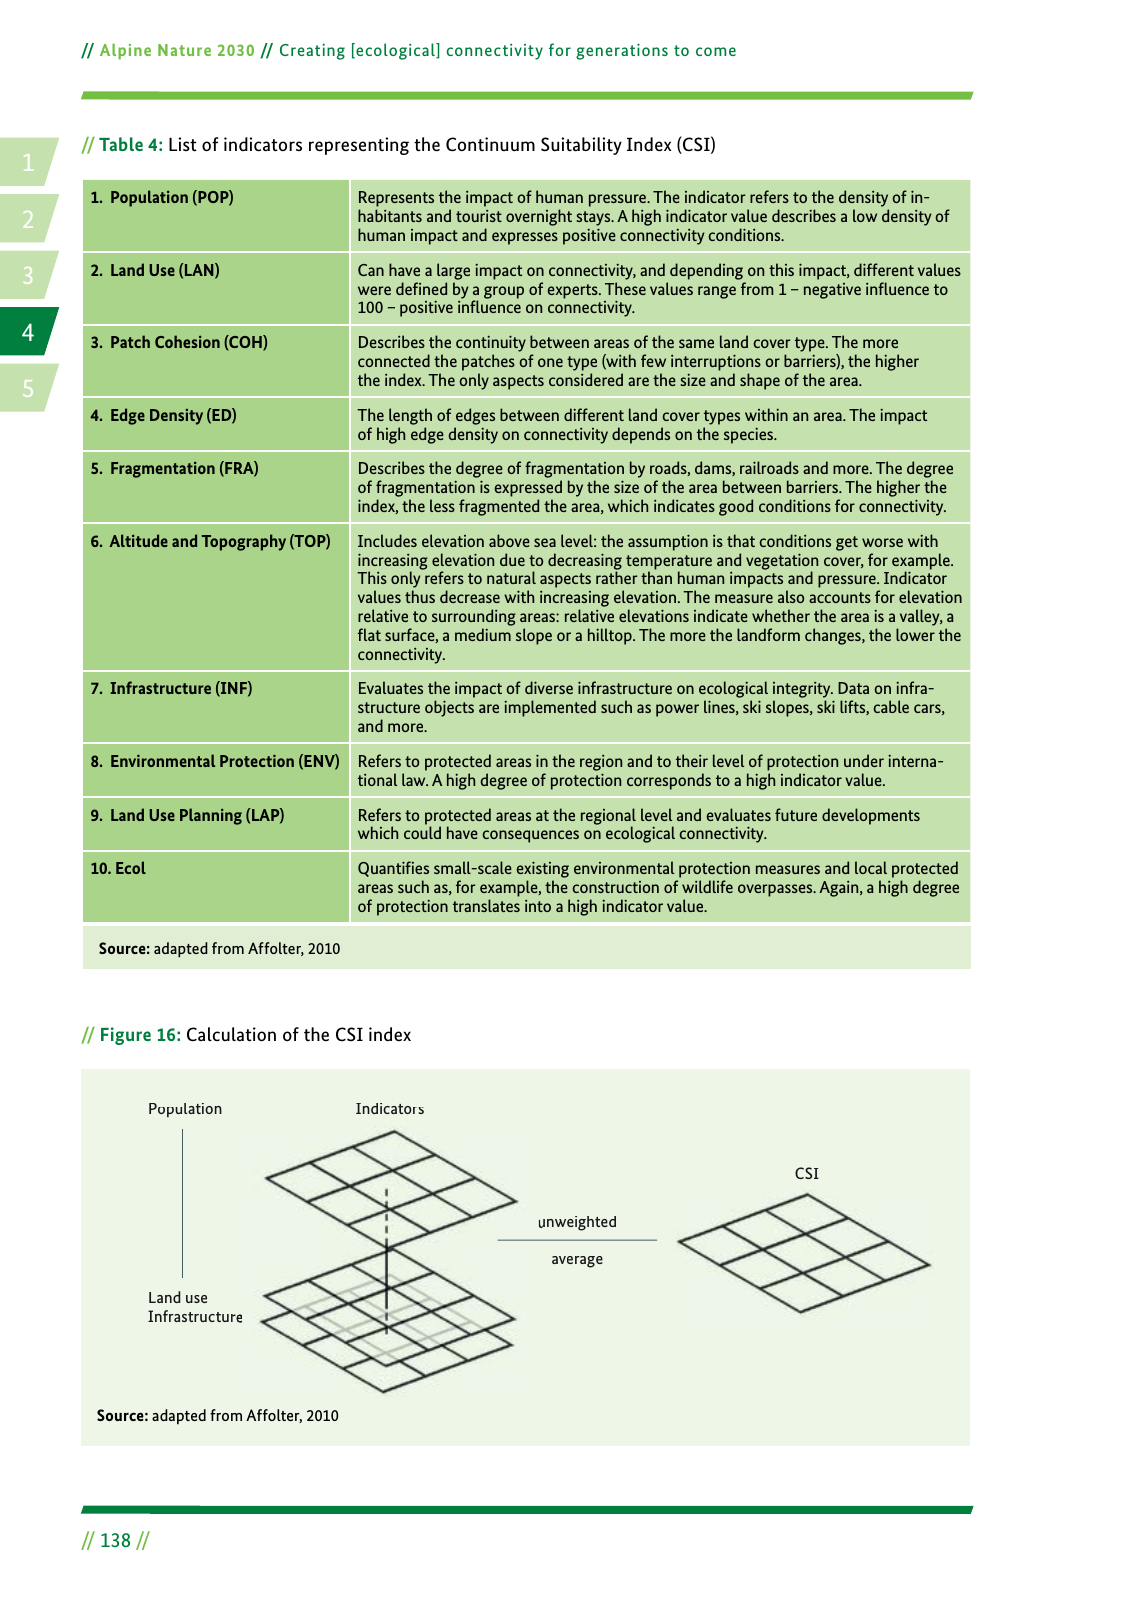
14 2 5 3 Alpine Nature 2030 Creating ecological connectivity for generations to come 138 1 Population POP Represents the impact of human pressure The indicator refers to the density of in habitants and tourist overnight stays A high indicator value describes a low density of human impact and expresses positive connectivity conditions 2 Land Use LAN Can have a large impact on connectivity and depending on this impact different values were de ned by a group of experts These values range from 1 negative in uence to 100 positive in uence on connectivity 3 Patch Cohesion COH Describes the continuity between areas of the same land cover type The more connected the patches of one type with few interruptions or barriers the higher the index The only aspects considered are the size and shape of the area 4 Edge Density ED The length of edges between different land cover types within an area The impact of high edge density on connectivity depends on the species 5 Fragmentation FRA Describes the degree of fragmentation by roads dams railroads and more The degree of fragmentation is expressed by the size of the area between barriers The higher the index the less fragmented the area which indicates good conditions for connectivity 6 Altitude and Topography TOP Includes elevation above sea level the assumption is that conditions get worse with increasing elevation due to decreasing temperature and vegetation cover for example This only refers to natural aspects rather than human impacts and pressure Indicator values thus decrease with increasing elevation The measure also accounts for elevation relative to surrounding areas relative elevations indicate whether the area is a valley a at surface a medium slope or a hilltop The more the landform changes the lower the connectivity 7 Infrastructure INF Evaluates the impact of diverse infrastructure on ecological integrity Data on infra structure objects are implemented such as power lines ski slopes ski lifts cable cars and more 8 Environmental Protection ENV Refers to protected areas in the region and to their level of protection under interna tional law A high degree of protection corresponds to a high indicator value 9 Land Use Planning LAP Refers to protected areas at the regional level and evaluates future developments which could have consequences on ecological connectivity 10 Ecol Quanti es small scale existing environmental protection measures and local protected areas such as for example the construction of wildlife overpasses Again a high degree of protection translates into a high indicator value Table 4 List of indicators representing the Continuum Suitability Index CSI Source adapted from Affolter 2010 Figure 16 Calculation of the CSI index Source adapted from Affolter 2010 Population Indicators unweighted average Land use Infrastructure CSI
Hinweis: Dies ist eine maschinenlesbare No-Flash Ansicht.
Klicken Sie hier um zur Online-Version zu gelangen.
Klicken Sie hier um zur Online-Version zu gelangen.