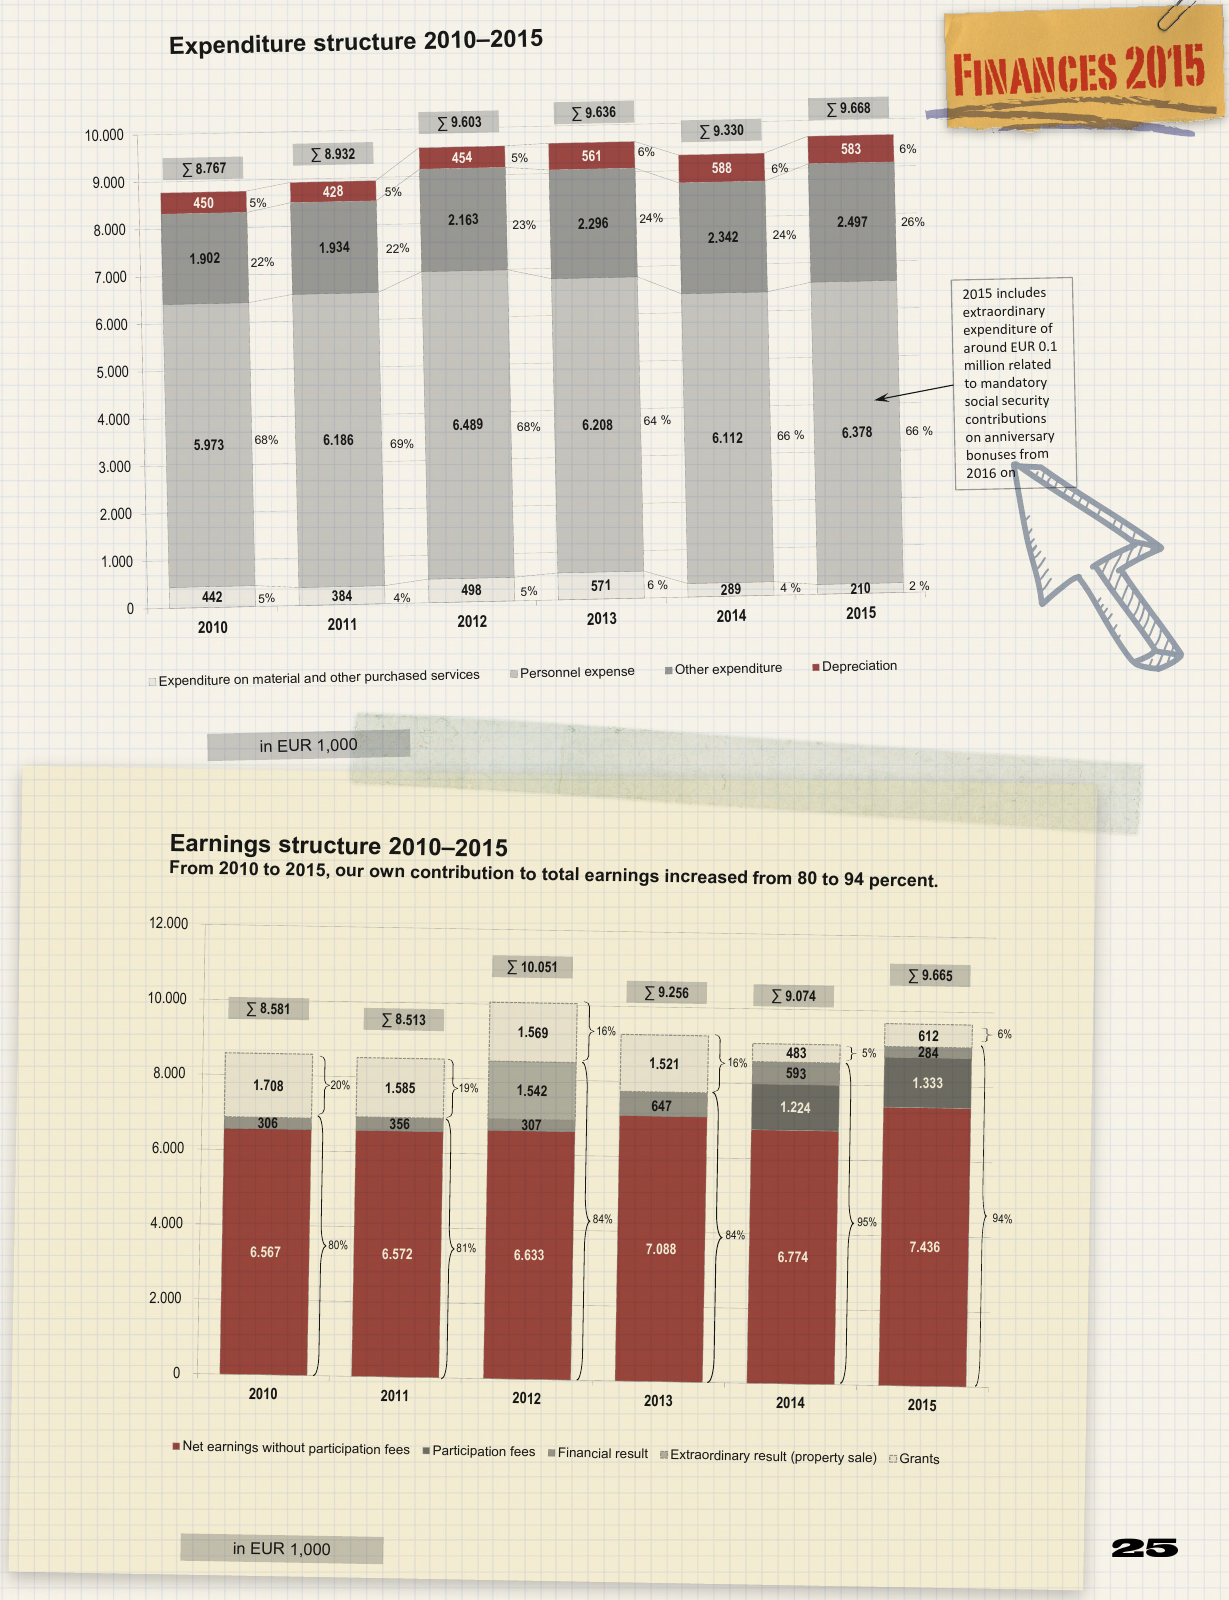
Finances 2015 25 442 384 49 8 571 289 210 5 973 6 186 6 489 6 208 6 112 6 378 1 902 1 934 2 163 2 296 2 342 2 497 450 428 454 561 588 583 0 1 000 2 000 3 000 4 000 5 000 6 000 7 000 8 000 9 000 10 000 2010 2011 2012 2013 2014 2015 Expenditure on material and other purchased services Per sonnel expense Other expenditure Depreciation Expenditure structure 2010 2015 in EUR 1 000 8 932 9 603 69 22 5 4 68 23 5 5 9 636 64 24 6 6 9 330 66 24 6 4 9 668 66 26 6 2 8 767 68 22 5 5 2015 includes extraordinary expenditure of around EUR 0 1 million related to mandatory social security contributions on anniversary bonuses from 2016 on 6 567 6 572 6 633 7 088 6 774 7 436 1 224 1 333 306 356 307 647 593 284 1 542 1 708 1 585 1 569 1 521 483 612 0 2 000 4 000 6 000 8 000 10 000 12 000 2010 2011 2012 2013 2014 2015 Net earnings without participation fees Participation fees Financial result Extraordinary result property sale Grants Earnings structure 2010 2015 From 2010 to 2015 our own contribution to total earnings increased from 80 to 94 percent in EUR 1 000 81 19 84 16 16 95 5 8 513 10 051 9 256 9 074 84 94 6 9 665 80 20 8 581
Hinweis: Dies ist eine maschinenlesbare No-Flash Ansicht.
Klicken Sie hier um zur Online-Version zu gelangen.
Klicken Sie hier um zur Online-Version zu gelangen.