Reason Magazine 2014 Quartal 2 Seite 34
Hinweis: Dies ist eine maschinenlesbare No-Flash Ansicht.Klicken Sie hier um zur Online-Version zu gelangen.
Inhalt
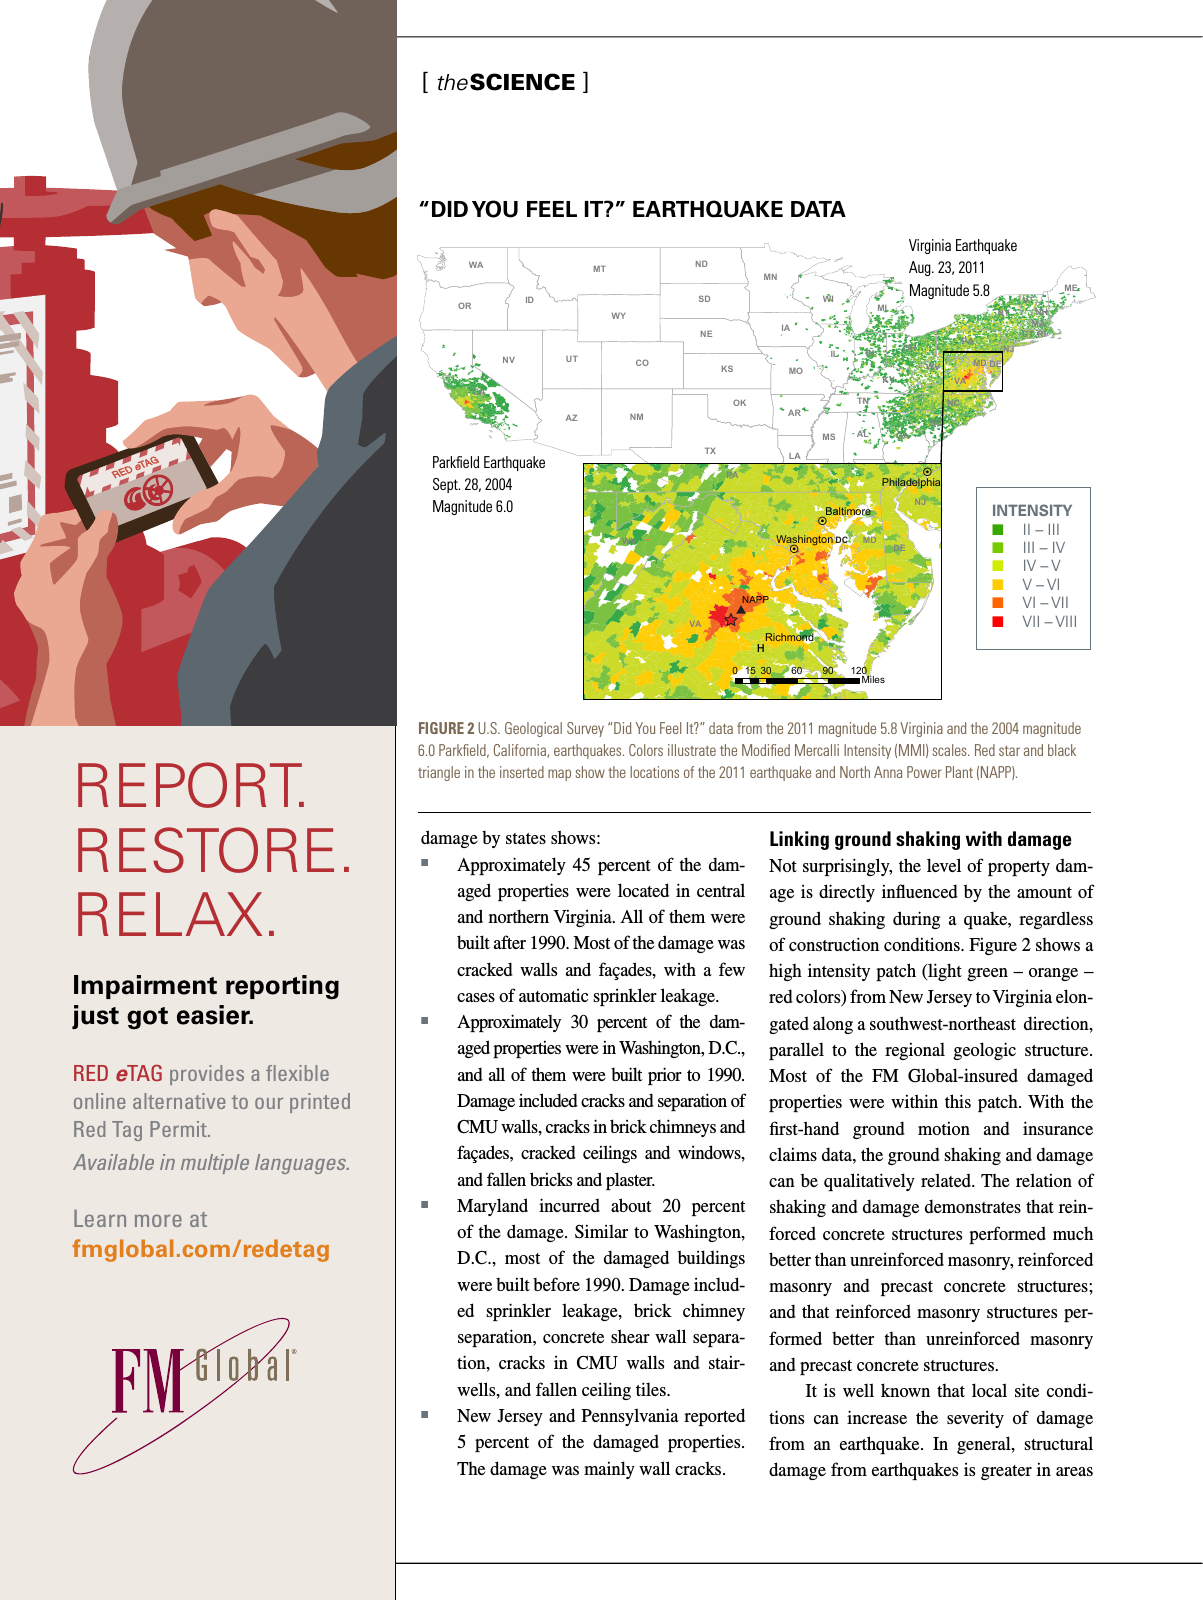
Linking ground shaking with damage Not surprisingly the level of property dam age is directly influenced by the amount of ground shaking during a quake regardless of construction conditions Figure 2 shows a high intensity patch light green orange red colors from New Jersey to Virginia elon gated along a southwest northeast direction parallel to the regional geologic structure Most of the FM Global insured damaged properties were within this patch With the first hand ground motion and insurance claims data the ground shaking and damage can be qualitatively related The relation of shaking and damage demonstrates that rein forced concrete structures performed much better than unreinforced masonry reinforced masonry and precast concrete structures and that reinforced masonry structures per formed better than unreinforced masonry and precast concrete structures It is well known that local site condi tions can increase the severity of damage from an earthquake In general structural damage from earthquakes is greater in areas damage by states shows n Approximately 45 percent of the dam aged properties were located in central and northern Virginia All of them were built after 1990 Most of the damage was cracked walls and façades with a few cases of automatic sprinkler leakage n Approximately 30 percent of the dam aged properties were in Washington D C and all of them were built prior to 1990 Damage included cracks and separation of CMU walls cracks in brick chimneys and façades cracked ceilings and windows and fallen bricks and plaster n Maryland incurred about 20 percent of the damage Similar to Washington D C most of the damaged buildings were built before 1990 Damage includ ed sprinkler leakage brick chimney separation concrete shear wall separa tion cracks in CMU walls and stair wells and fallen ceiling tiles n New Jersey and Pennsylvania reported 5 percent of the damaged properties The damage was mainly wall cracks DID YOU FEEL IT EARTHQUAKE DATA FIGURE 2 U S Geological Survey Did You Feel It data from the 2011 magnitude 5 8 Virginia and the 2004 magnitude 6 0 Parkfield California earthquakes Colors illustrate the Modified Mercalli Intensity MMI scales Red star and black triangle in the inserted map show the locations of the 2011 earthquake and North Anna Power Plant NAPP REPORT RESTORE RELAX Impairment reporting just got easier RED eTAG provides a flexible online alternative to our printed Red Tag Permit Available in multiple languages Learn more at fmglobal com redetag TX MT CA ID AZ NV NM OR CO WY ILUT MN SD IA KS NE ND WI WA OK MO FL MI IN GA NY AL AR PA NC LA TN MS KY OH VA ME SC WV VT NH MD NJ MA CT DE RI H Richmond Baltimore Washington Philadelphia NAPP VA MD PA WV DE NJ DC 0 30 60 90 12015 Miles INTENSITY n II III n III IV n IV V n V VI n VI VII n VII VIII Parkfield Earthquake Sept 28 2004 Magnitude 6 0 Virginia Earthquake Aug 23 2011 Magnitude 5 8 theSCIENCE