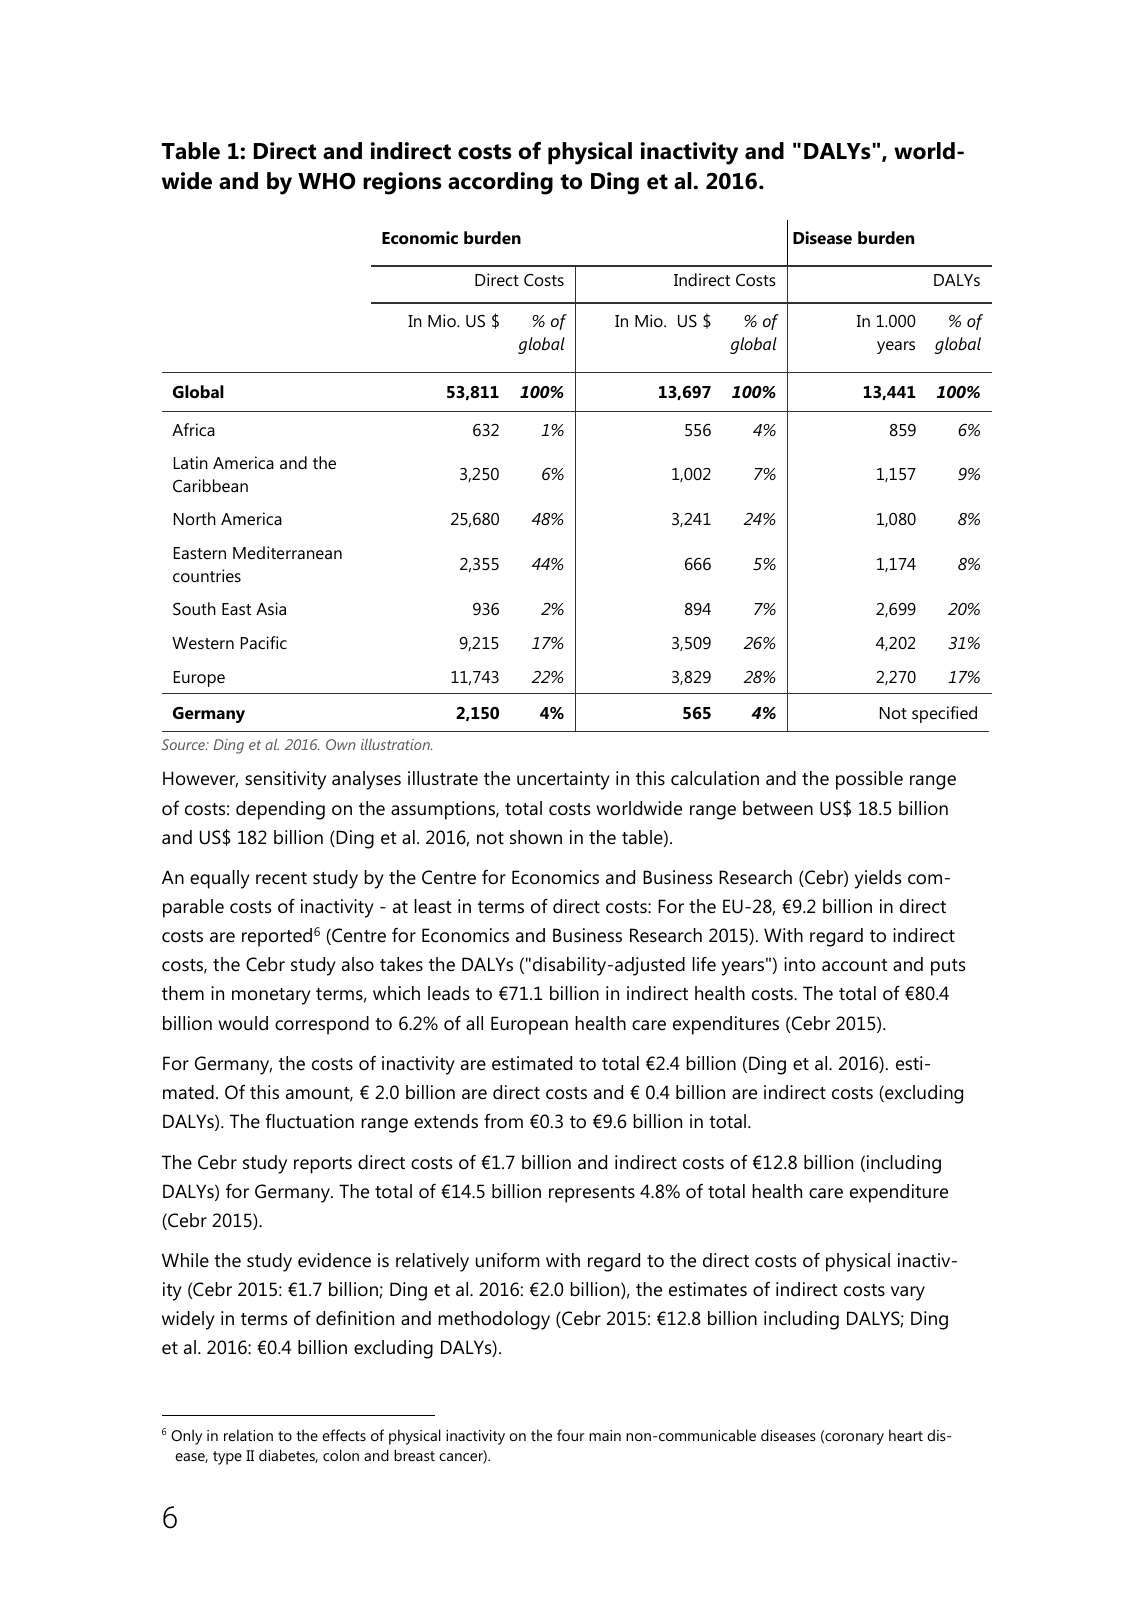
6 Table 1 Direct and indirect costs of physical inactivity and DALYs world wide and by WHO regions according to Ding et al 2016 Source Ding et al 2016 Own illustration However sensitivity analyses illustrate the uncertainty in this calculation and the possible range of costs depending on the assumptions total costs worldwide range between US 18 5 billion and US 182 billion Ding et al 2016 not shown in the table An equally recent study by the Centre for Economics and Business Research Cebr yields com parable costs of inactivity at least in terms of direct costs For the EU 28 9 2 billion in direct costs are reported6 Centre for Economics and Business Research 2015 With regard to indirect costs the Cebr study also takes the DALYs disability adjusted life years into account and puts them in monetary terms which leads to 71 1 billion in indirect health costs The total of 80 4 billion would correspond to 6 2 of all European health care expenditures Cebr 2015 For Germany the costs of inactivity are estimated to total 2 4 billion Ding et al 2016 esti mated Of this amount 2 0 billion are direct costs and 0 4 billion are indirect costs excluding DALYs The fluctuation range extends from 0 3 to 9 6 billion in total The Cebr study reports direct costs of 1 7 billion and indirect costs of 12 8 billion including DALYs for Germany The total of 14 5 billion represents 4 8 of total health care expenditure Cebr 2015 While the study evidence is relatively uniform with regard to the direct costs of physical inactiv ity Cebr 2015 1 7 billion Ding et al 2016 2 0 billion the estimates of indirect costs vary widely in terms of definition and methodology Cebr 2015 12 8 billion including DALYS Ding et al 2016 0 4 billion excluding DALYs 6 Only in relation to the effects of physical inactivity on the four main non communicable diseases coronary heart dis ease type II diabetes colon and breast cancer Economic burden Disease burden Direct Costs Indirect Costs DALYs In Mio US of global In Mio US of global In 1 000 years of global Global 53 811 100 13 697 100 13 441 100 Africa 632 1 556 4 859 6 Latin America and the Caribbean 3 250 6 1 002 7 1 157 9 North America 25 680 48 3 241 24 1 080 8 Eastern Mediterranean countries 2 355 44 666 5 1 174 8 South East Asia 936 2 894 7 2 699 20 Western Pacific 9 215 17 3 509 26 4 202 31 Europe 11 743 22 3 829 28 2 270 17 Germany 2 150 4 565 4 Not specified
Hinweis: Dies ist eine maschinenlesbare No-Flash Ansicht.
Klicken Sie hier um zur Online-Version zu gelangen.
Klicken Sie hier um zur Online-Version zu gelangen.